
Comprehensive statistics
In the extensive timetable statistics, very detailed information on bookings and flight line-ups can be filtered out:

Analysis
In this tab, you define the period over which the figures are to be filtered and how they are to be summarised:
- Specify the period over which you would like to have the analysis. To do this, enter the date manually (right-click in the date window to display a calendar) or tick today and select in the next field how many days you want to calculate forwards or backwards from the selected time.
- Click on the days of the week that you would like to have analysed
- The type of evaluation can be output daily or summarised.
- With the time subdivision you have the option of summarising a period of time, e.g. morning/afternoon or morning/midday/evening, etc.
- Figures that are not filtered are shown here
- Displays the total of all bookings in the timetable
Column 1-10
You have the option of displaying 10 different analyses next to each other in a list.
Important! First click on the  button!!!

- With the wide selection you can print simple evaluations of bookings or persons, but also determine the utilisation of the seat in relation to flight compositions with and without duration. There is a large selection, try out the various options for counting, duration, composition, etc
- Name the column briefly and succinctly
- Define the area or areas from which the numbers are to be drawn.
- The evaluation can be made in relation to a specific group of people or globally. Tip: If you frequently work with tour operators/travel agencies/hotels, you can filter these bookings separately. Define the person filter so that it refers to the tour operator, travel agency or hotel by entering TOUROP in the additional information. Now tick the box next to Check reference. The filter is now applied to the tour operator and not to the booked player.
- If you determine which bookings are to be counted, you can also filter whether more 9 or 18-hole rounds are booked.
- The categories can be used to differentiate between, for example, individuals or groups (which are booked as a block or filter with number).
- The status of the booking comes into play if, for example, you want to find out how many bookings are deleted.
- In the booking method, you can differentiate the bookings by origin. Were they made locally or via the app, etc.?
In the following expression, we assume the same starting position as with the classic statistics.
The numbers printed in normal type are the numbers in the time intervals set above.
The bold printed figures show the daily total.
Example:

Please note: If you carry out the analysis over several days, the individual daily totals may deviate from the overall total. For example, if timetable bookings do not relate specifically to a guest or a member. In our example, only one day was analysed.
Special: List of expected sales
You can also use the comprehensive timetable statistics to forecast revenue. This means that not only the rounds that have already been booked are printed out, but also the resulting revenue. The prerequisite for this is that each booking is provided with an article:
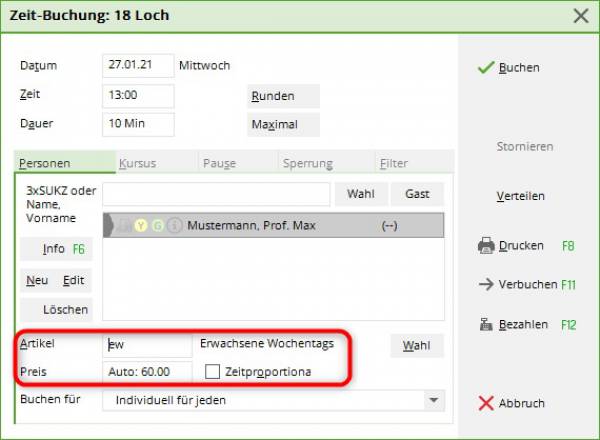
This entry can be controlled via the article automation or entered manually.
To have the price calculation listed in the statistics, select the following option:

In our screenshot, provisional bookings are also activated for the calculation. This makes sense if you work with hotels or tour operators and also want to include bookings that have not yet been definitively confirmed in your calculation.
This is what your statistics will look like:

Back to the Overview
- Keine Schlagworte vergeben
PC CADDIE AG
Bachtelweg 3
6048 Horw/Luzern
Schweiz
Kontakt
![]() Fon +49 2642 9854110
Fon +49 2642 9854110
Fax +49 2642 9854199
![]() Fon +41 41 5110600
Fon +41 41 5110600
Fax +41 41 5110699
![]() Fon +43 13 55667788
Fon +43 13 55667788
Fax +43 13 55667799
Mail support@pccaddie.com
Web www.pccaddie.com
Support Online-Module
PC CADDIE://online
GmbH & Co. KG
Fon: +49 2642 9854120
Fax: +49 2642 9854169
Mail support@pccaddie-online.de
Web www.pccaddie-online.de
Tägliche Supportzeiten:
April-Oktober
09.00 - 20.00 Uhr
November-März
09.00 - 18.00 Uhr