Inhaltsverzeichnis
Business Dashboard

From now on, all golf-relevant core information will appear together in a new window, like on a customer report page. All core figures are differentiated according to point of sales (profit centres): from tournaments, restaurant, hotel, ball purchases from machines, tee time bookings. You can see all sales figures, attendance figures and membership data summarised and also displayed in pie charts and bar charts
This means that all business figures can be viewed automatically and easily in context. The PC CADDIE Management Report can be used to create and provide further reports for analysing and evaluating the success of business areas in comparative periods.
Costs: The Business Dashboard will be an integral part of PC CADDIE Customer Management from the 2019 seasonBusiness. Every PC CADDIE customer will be able to personalise and predefine the business dashboard for their golf course - and use it free of charge.
Important: An initial report setup and the PC CADDIE contribution management are required for display. Please contact our support team at support@pccaddie.com .
Requirements
To ensure that sales are distributed to the relevant profit centres in a way that makes sense for you, the corresponding configuration should be made in the management report. You can find the menu item for this in PC CADDIE under Persons/Management Report. You can read the documentation here: Management Report.
Customer dashboard for members or guests
You will find the „Report“ button on the right-hand side of the customer screen. This opens the dashboard.
Visits
In the menu window Visits you will find various lists/diagrams showing how often a guest is on your golf course during a certain period (in our example 01.01.18 - 02.08.18). The period is not freely selectable; PC CADDIE always calculates automatically from 1 January (of the respective year) to the print date.
- Current total number of visits
- Last activities in the Point of Sales, differentiated by timetable bookings (TT), tournament bookings (TURN), sales bookings in cash registers (SALE LOCAL) or sales bookings in contribution account areas (SALE).
- Current attendance figures by point of sales: tee times, tournament rounds, green fees, driving range, pro shop, catering, hotel or other.
- Overview of the tournament rounds played with the corresponding tournament date
Membership
You can access this membership data via the menu window Membership menu window:
- Current membership
- Membership history
Turnover
In the menu window Turnover menu window, the dashboard shows you the following:
All sales figures are gross amounts.
- Turnover shares - pie chart percentages and amounts by point of sales: green fee, driving range, pro shop, catering, hotel and other
- Daily sales - sales lists with account areas, product groups, item description and amount
- Sales totals - bar chart by month
Total overview
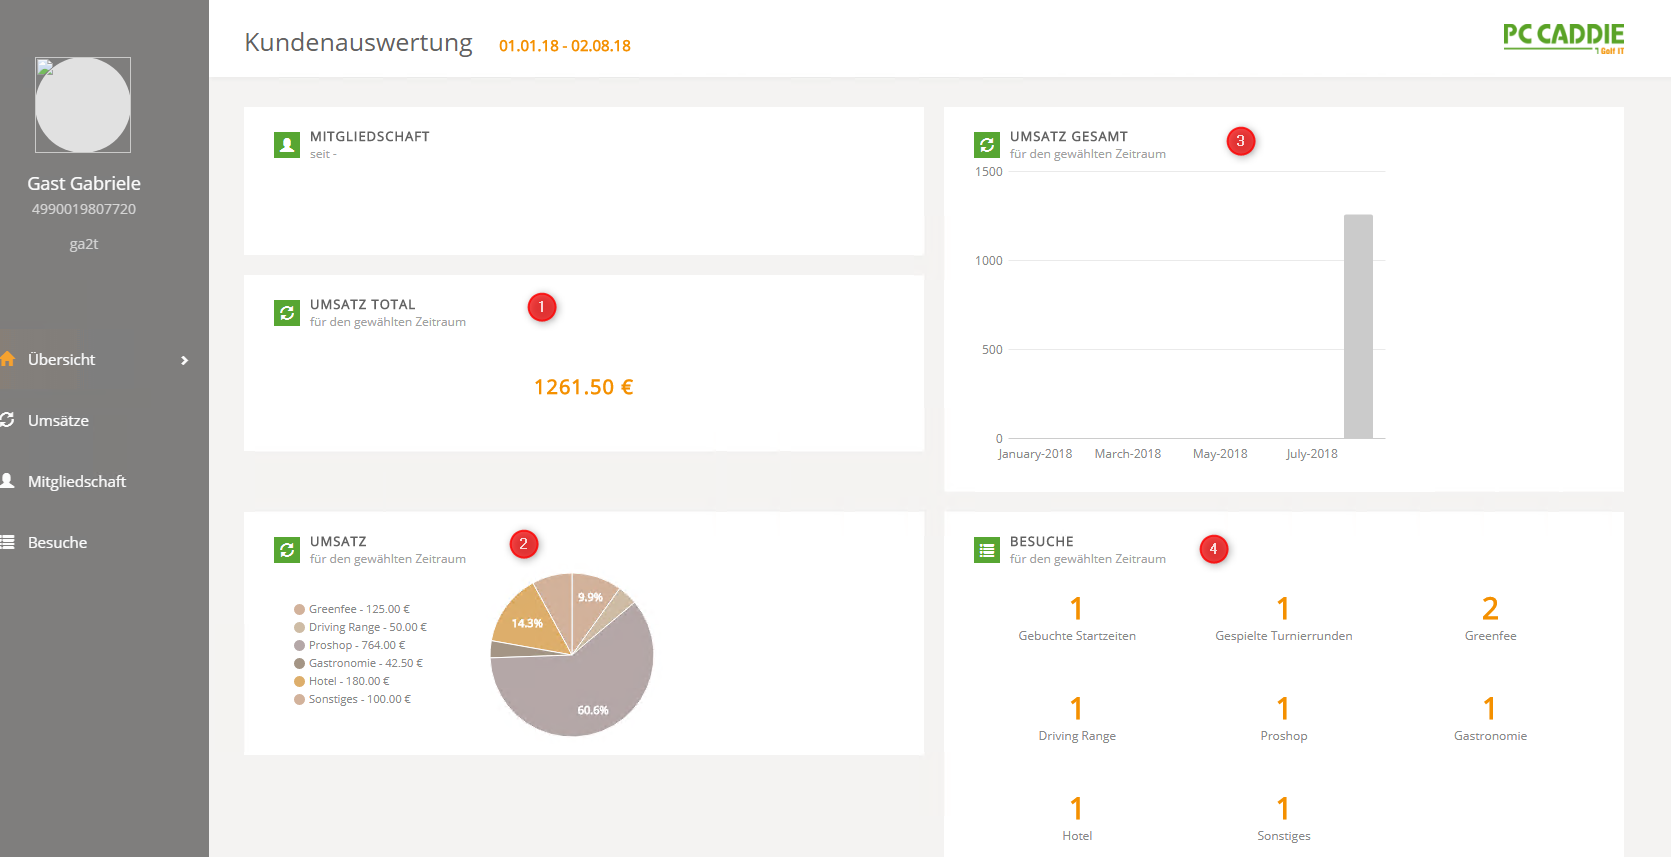
In the menu window Overview you will find the following contents:
The sales are gross amounts.
- Total turnover - total in the selected period.
- Total turnover - pie chart by point of sales: green fee, driving range, pro shop, catering, hotel and other.
- Total turnover - bar chart broken down by month.
- Total visits - totals by point of sales: tee times, tournament rounds, green fee, driving range, pro shop, catering, hotel or other.
- Keine Schlagworte vergeben


